- Call Us+1-877-533-0002
- Email atcontact@atomiq.us
Analytics & Reporting
Attended Automation
AtomIQ’s UI component enables you to track, aggregate and visualize key performance indicators in real-time directly on end users’ day-to-day interfaces.
End users assimilate the real-time changes to the business and rapidly respond to those patterns leading to agile and effective decision making.
Key Features
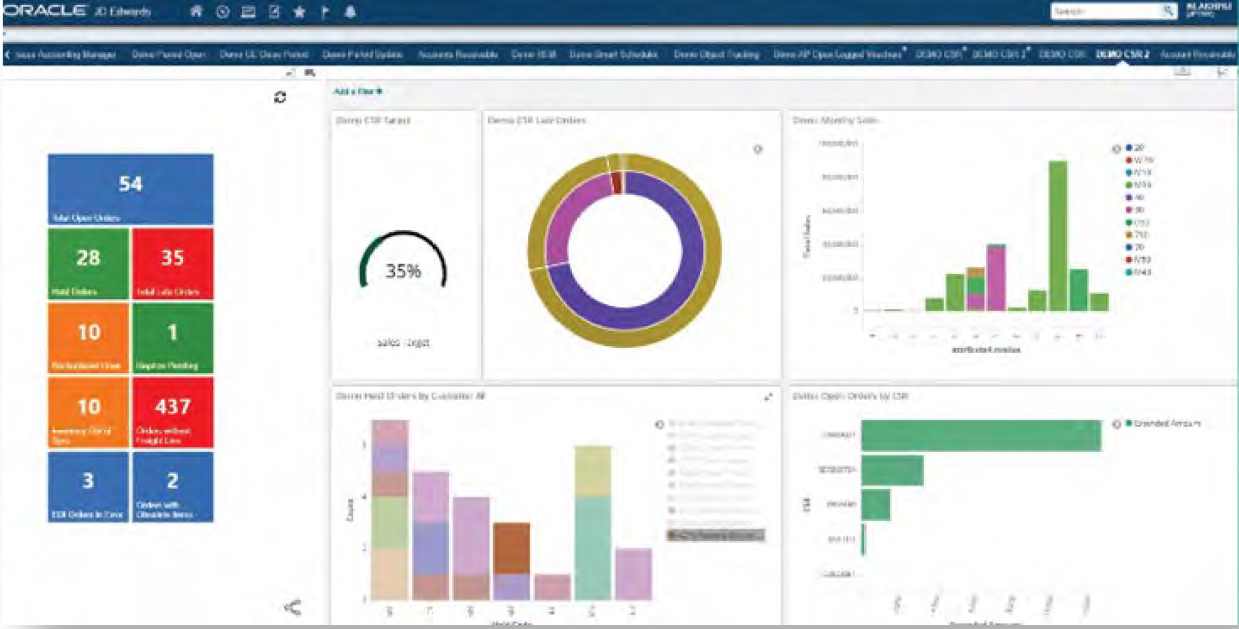
Rich Interactive Visualization
Visualize your data in real-time with advanced operational analytics. Rich visualizations can be created with a few clicks with data sourced from disparate systems and unified in AtomIQ, serving as a central cockpit for cross-platform data and events. This also allows score boarding and gamification of business processes.
Embedded Dashboards
Leverage pre-built dashboards that can be used as-is or customized to your unique business process. These centralized end user dashboards are developed to manage exceptions in business processes. They integrate seamlessly with your ERP’s UI, without a learning curve for end users.
Widgets
AtomIQ’s analytics platform is driven by its automation foundation – allowing business data to be dynamically leveraged in unified widgets which not only show data but also allows users to trigger a chain of pre-programmed events.
Data Security
Role and data-based row security allows dashboards to be designed once and deployed many times, saving on implementation and maintenance costs. This also allows data to be presented to 3rd parties including vendors and customers.
Single Sign On
Seamless integration with Active Directory across multiple applications without requiring user credentials to be entered manually.
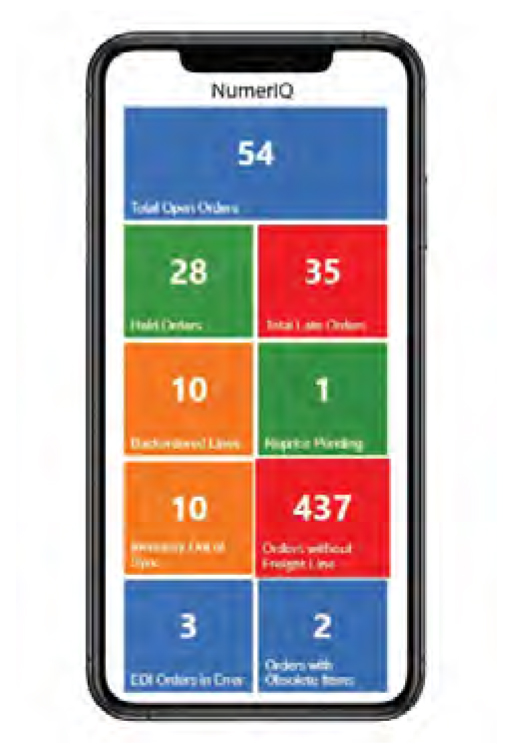
Mobile Support*
With the upcoming mobile application, users will be able to access all features available in desktop version.